Effect of Battery Process on Component Decay
The production process of the battery slice is an extremely important process. The stability and the difference of the process parameters will cause great fluctuations in the power output of the battery slice, indirectly causing the attenuation of the assembly to be too large and the product to be unqualified. Based on this, this article begins with some important steps in the production process of the battery slice, find out the problems that exist in it, optimize and improve, improve the product quality, and save the cost.
1Battery process power loss analysis of components
1.1 Optical loss
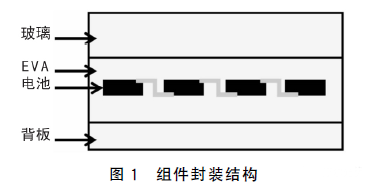
The spectral response of ground-based silicon solar cells is generally in the range of 300 nm to 1100 nm. Therefore, any light entering this band will cause optical loss [1]. It can be analyzed from both light transmission and reflection [2]. An anti-reflection film, ie, a silicon nitride film, is deposited on the surface of the solar polycrystalline cell, and EVA and tempered glass (the refractive index of the two are about 1.48) are formed after the assembly is made, as shown in FIG. 1 . . In order to maximize the transmissivity of the component, it is also necessary to obtain the best matching results of the refractive index of the SiNx film, the refractive index of the EVA and the glass, and the best optical anti-reflection effect, which can effectively increase the components. The output power.
AR coating is based on the principle of thin film interference, coating the surface of the media layer or multilayer film, can effectively reduce the reflection of light, this film is anti-reflection film [3]. When the light is perpendicularly incident, the reflectivity of the medium surface is shown in equation (1):

According to the above principle, the refractive index of the corresponding silicon nitride film can be designed according to the different refractive indexes of the component tempered glass or coated glass and EVA, and the optical optimal matching of the components can be achieved.
1.2 Electrical losses
Battery-induced electrical losses include current mismatch when the battery is connected in series, contact resistance between the electrode and the electrode, power loss due to nonuniform diffusion resistance, and edge short circuit caused by friction on the edge of the battery. This article mainly studies the non-uniform diffusion resistance and the electrical loss of battery friction. Non-uniform diffusion resistance means that after the diffusion, the silicon wafer partially diffuses into the area. The square resistance value of this area is large, which may easily result in excessive leakage and high cell string resistance. When receiving light, due to the non-uniformity of the square resistance, the smaller area of ​​the square resistance of the battery is prone to overheating, resulting in an increase in the temperature of the battery, which in turn causes a decrease in efficiency. Figures 2 and 3 show diffused uneven silicon and EL images.

Friction loss is mainly found in the battery cells using the wet edge-cutting process. After the cell sheet has been screen-printed and sintered, the belt is subjected to friction during the belt transfer, quality inspection, component welding, etc. The metal particles on the edges are left behind, resulting in increased leakage and reduced efficiency.
2 experimental program and analysis
2.1 Formulation Optimization Experiment of PECVD [4]
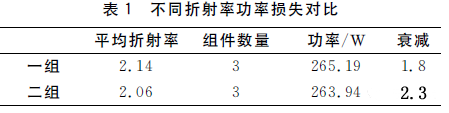
Design two sets of double-layer silicon nitride film experiments with different refractive indices, one set with air, double layer silicon nitride and silicon wafer as optical transmission medium; the other set with tempered glass and EVA, double-layer silicon nitride, and silicon wafer For transmission media. Based on the known refractive index of air of 1.0, the refractive index of component tempered glass and EVA of 1.48, and the refractive index of silicon of 2.76, the refractive index of two sets of silicon nitride bilayer films can be calculated. Select the battery to absorb the maximum wavelength of 600nm to calculate the corresponding double film thickness. The above two sets of materials were used as components to test their attenuation. The results of the packaging are shown in Table 1.
2.2 Experiments of nonuniform diffusion resistance
Two sets of diffusion test pieces were selected, each set with 600 pieces. The deviation within one set was large, and the square resistance of the two sets was uniform. A total of six components were produced. FIG. 4 is an EL diagram of two groups of components. As can be seen from FIG. 4 , there is a clear dark or bright area in the large deviation EL image.
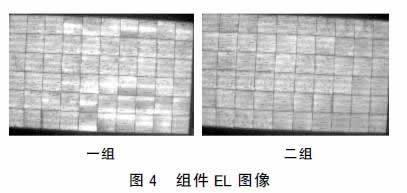
Table 2 shows the component test data. It can be seen from the data in Table 2 that the larger power loss in the on-chip square resistance is larger, mainly because the square resistance is larger and the current distribution inside the solar cell is not even, resulting in partial shallow junctions. The resistance is large, and it easily leads to an increase in leakage, eventually resulting in a large power loss.
2.3 Cell Friction Experiment
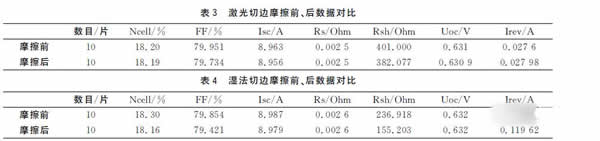
Choose two groups of cells with the same efficiency, 10 in each group. One group uses laser trimming. The second group uses normal wet trimming. Artificially simulates the friction between the sheets and observes the data before and after rubbing. Table 3 and Table 4 show the comparison of the data before and after the friction. From the data in Table 4, it can be seen that the data before and after the laser trimming friction is relatively stable, while the difference between the data before and after the wet trimming friction is relatively obvious, mainly in the reduction of the resistance and resistance, the increase of the reverse current, and the decrease of the filling. .
Use a microscope to observe the front and rear edges of the cell, as shown in Figure 5.

As shown in Figure 5, bright spots appear on the edge of the cell after rubbing. The composition should be analyzed as a paste, which is responsible for short-circuiting the edge after rubbing; and after laser trimming, the laser cuts the PN junction at the front edge, even if the edge remains a slurry. Powder does not affect its conductivity.
3 conclusions
The power loss of the module is divided into optical loss and electrical loss. The optical loss can be optimized by matching the refractive index of silicon nitride to match the component glass and EVA; in the electrical loss, the uneven diffusion needs to adjust the diffusion formula parameters, and the surface uniformity of the textured surface is reduced. Within the deviation [5]; battery friction can be used to clean the transmission belt daily, change the quality inspection method and other methods to solve.
references:
[1] Shuai Zhengfeng, Yang Hong, Lei Xiandao. Crystal silicon solar module package electrical loss analysis [J]. Power Technology, 2014(1):82-84.
[2] YANG H, WANG H. Performance analysis of crystalline solar modules with the same peakpower and thedifferent structure [J]. Clean Technologies and Environmental Policy, 2011(13):527-533.
[3] Li Zhonghua. Crystal silicon solar cell double antireflection film research [D]. Beijing: Beijing Jiaotong University, 2011:14-15.
[4] Wu Qingxin, Chen Guanghong, Yu Ying, et al. Silicon nitride growth process by PECVD [J]. Functional Materials, 2007, 5(38): 703-705.
[5] He Tangui, Tang Guang. Uniformity of the diffusion atmosphere field of crystalline silicon solar cells [J]. Electronic Design Engineering, 2009, 17(9):55-57.
Wireless Remote Control Grow Light 100W
Wireless Remote Control Grow Light 100W,LED Plant Lighting,Square Grow LED Light,Square Plant Light
Yichang Green Eco-agriculture Co., Ltd. , https://www.plantgrowlamp.com